Taos Real Estate Intelligence — Special Report
Inside the Taos Housing Market: What the Numbers Don’t Tell You
A special Taos Real Estate Intelligence report on sales, unsuccessful listings, contract failures, pricing strategies, and what it really takes to sell a home in 2026.

By Chad BelvillAssociate Broker, Dreamcatcher Real Estate Co. Inc.Research: HomeHeading Intelligence
- Published
- Data through
How’s the market?
It’s probably the question I’m asked most frequently as a real estate broker in Taos.
And it’s a deceptively difficult question to answer well.
We can look at the number of homes currently for sale, how many sold last month, median sale prices, and days on market. Those are important indicators, and they’re the foundation of the weekly Taos Real Estate Intelligence Reports I publish.
But I’ve become increasingly interested in what those statistics don’t tell us.
What happens to the homes that don’t sell? How many listings expire or are withdrawn, only to return to the market months later? How often do contracts fall apart before a property finally closes? And when some homes sell quickly while others remain on the market for months—or even years—what explains the difference?
Most importantly, what does all of this tell us about the actual health and behavior of the Taos housing market?
To investigate these questions, I turned to HomeHeading Intelligence, an independent real estate research platform I’ve been developing to preserve, connect, and analyze historical market records.
Rather than examining only the current status of a listing or its eventual sale, HomeHeading Intelligence can reconstruct individual property histories across multiple MLS records, including unsuccessful marketing attempts and changes that may no longer be visible in conventional historical reports.
For this investigation, I examined residential market activity extending back to 2016, including 3,733 individual single-family properties, 5,270 MLS listing records, and more than 4,100 reconstructed sale attempts.
The results offer a more complete—and sometimes surprising—picture of the Taos housing market.
The Market at a Glance
Four findings from the research, each measured for a different group of homes and period. The sections below explain each one.
1. A market returning to familiar territory
Let’s begin with the broader market.
Through September 2026, Taos County recorded 218 single-family residential closings, approximately 6% more than during the same period in 2025 and 24% more than in 2024.
Buyers are still purchasing homes. Transactions are happening.
Yet many homeowners and brokers are experiencing a market that feels noticeably slower and more difficult than it did just a few years ago.
Both observations can be true.
At the end of September, approximately 299 single-family homes were available for sale in Taos County, representing 10.6 months of supply.
To put that into perspective, months of supply during September in 2016–2019 ranged from approximately 10.8 to 12.9 months. During the extraordinary market of 2020–2022, that figure fell to roughly 4.5–5.4 months.
Current conditions are much closer to the years before the pandemic than to the unusually competitive market that followed it.
The difference is significant.
During the pandemic-driven expansion, buyers competed for limited inventory and often moved quickly. By comparison, today’s buyers have considerably more choice, and sellers face competition from other available properties.
That doesn’t mean the market has stopped functioning. It means the environment in which transactions take place has changed.
And those changes become much clearer when we follow individual listings over time.
Figure 1 · Taos market anatomy, 2016–2026
Available inventory and how long it has been exposed
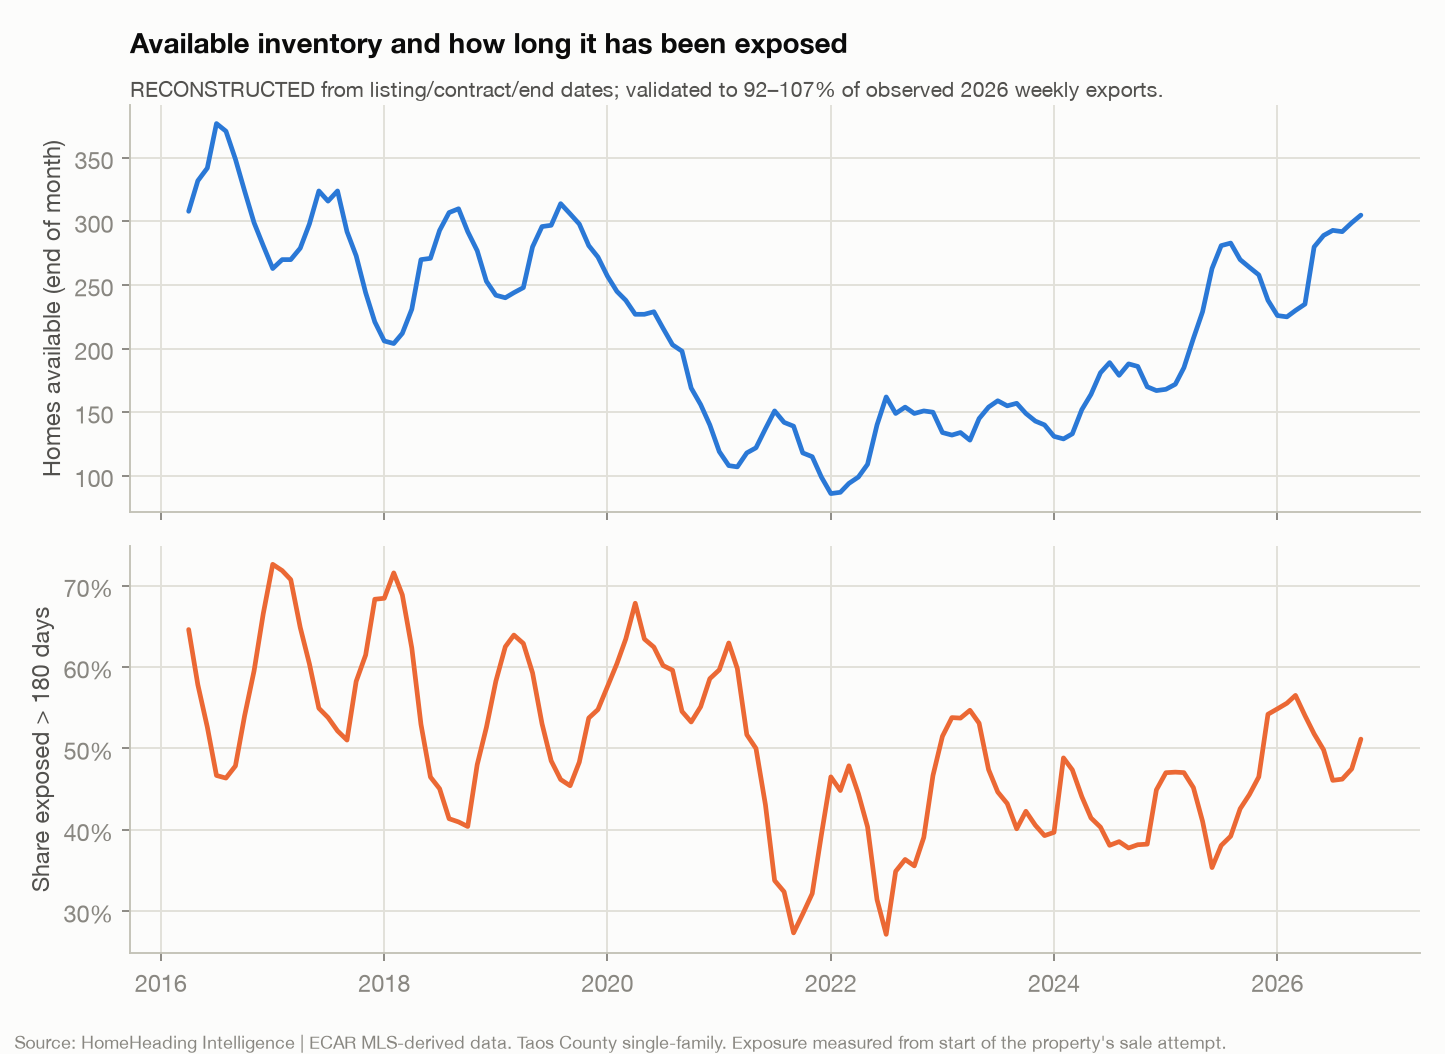
The top panel counts single-family homes available at the end of each month; the bottom panel shows the share that had been exposed to the market for more than 180 days, measured from the start of each property’s sale attempt rather than its latest MLS listing. Both are rebuilt from listing, contract and closing dates; checked against the weekly listing exports observed in 2026, the rebuilt counts came within 92–107% of what was actually observed.
Method: RECONSTRUCTED from listing/contract/end dates; validated to 92–107% of observed 2026 weekly exports.
Source: Monthly inventory reconstructed from listing records; exposure measured from the start of each sale attempt. Taos County single-family homes. HomeHeading Intelligence analysis of Enchanted Circle Association of REALTORS® MLS records observed through October 18, 2026. Data deemed reliable but not guaranteed. Full-size chart: Available inventory and how long it has been exposed
2. Not every home that enters the market sells
One of the limitations of conventional market reporting is its emphasis on completed sales.
Sold-property statistics tell us what buyers purchased and what they paid. They don’t necessarily tell us what happened to properties that failed to attract a buyer, withdrew from the market, or required multiple attempts before eventually selling.
The historical data reveals that unsuccessful marketing attempts are a substantial and persistent feature of the Taos market.
From January through September 2026, 218 single-family home sales closed, while 142 listings expired or were withdrawn without a completed transaction.
That means unsuccessful exits represented approximately 39% of listing records reaching one of those resolved outcomes during the period.
Because withdrawn-listing captures stopped after September 13, 2026, the outcomes of 31 listings remain unknown, and the 142 unsuccessful exits—and therefore that share—may be understated.
For comparison, the equivalent share during 2017–2019 ranged from approximately 36% to 40%. During the exceptionally strong market of 2021–2022, it fell to approximately 17–26%.
In other words, today’s rate of unsuccessful listing outcomes is not historically unprecedented. It’s much closer to what the Taos market experienced before the pandemic.
Figure 2 · Taos market anatomy, 2016–2026
Sales versus unsold exits per quarter
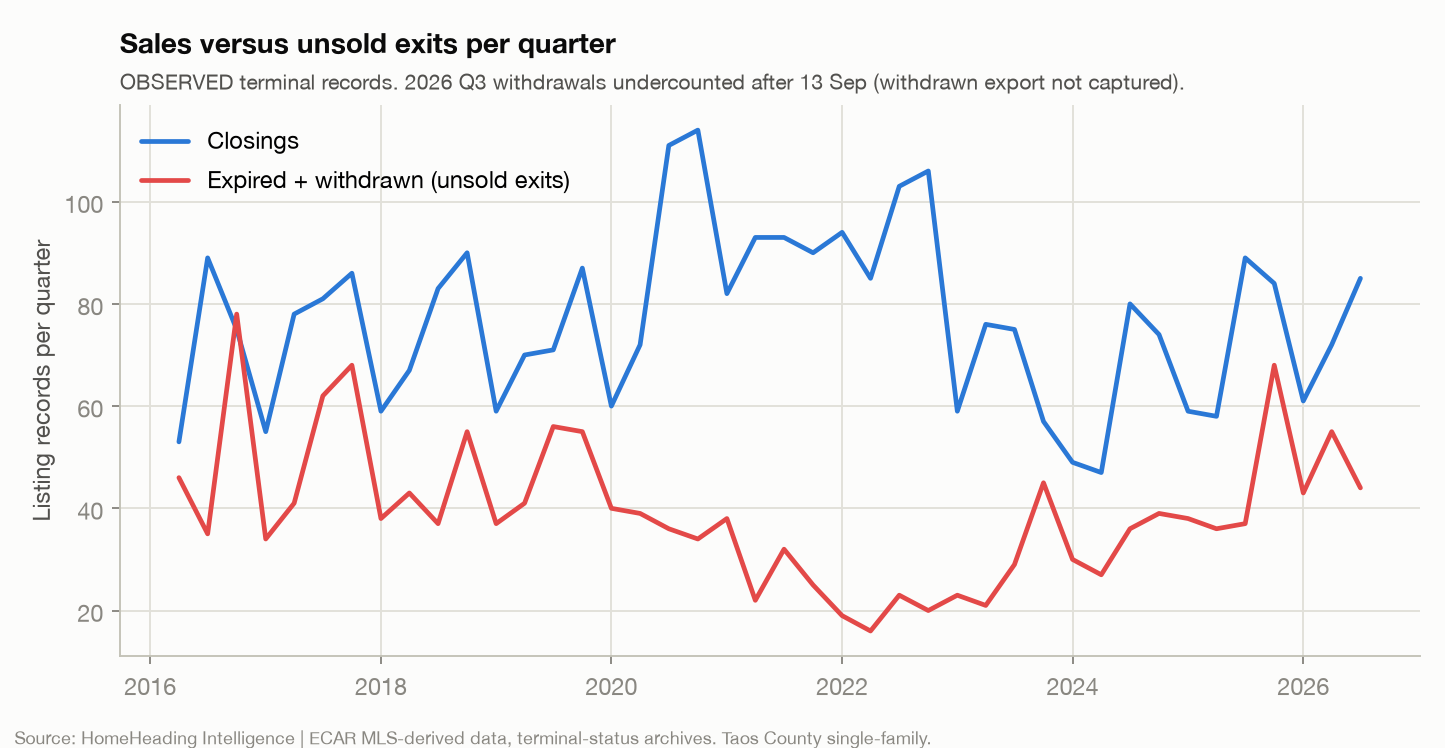
Listing records that closed each quarter, compared with listings that expired or were withdrawn without a sale. These count listing records, not properties: a home that expired and later sold under a new listing appears in both lines. Withdrawals after September 13, 2026 were not captured, so unsold exits in the third quarter of 2026 are undercounted.
Method: OBSERVED terminal records. 2026 Q3 withdrawals undercounted after 13 Sep (withdrawn export not captured).
Source: Terminal-status archives. Taos County single-family homes. HomeHeading Intelligence analysis of Enchanted Circle Association of REALTORS® MLS records observed through October 18, 2026. Data deemed reliable but not guaranteed. Full-size chart: Sales versus unsold exits per quarter
But there’s an important distinction between a failed listing and a property that never sells.
A home may expire, be relisted at a different price, and eventually close. Counting the original expired listing as a permanent failure would misrepresent the outcome of the property itself.
That’s why this study examines several different measures of market success.
Across sale attempts initiated between 2016 and 2023, approximately 76–88% ultimately resulted in an MLS-recorded sale by the October 2026 observation cutoff.
When successive listings separated by no more than 90 days are grouped into a continuous marketing campaign, approximately 74% of resolved campaigns ended in a sale.
The difference between listing-level and property-level results tells us something important: A meaningful portion of the market’s activity consists of repeated attempts to sell properties that did not succeed the first time.
And many of those attempts require considerably more time than a single MLS listing would suggest.
Figure 3 · Taos market anatomy, 2016–2026
What happened to each marketing campaign
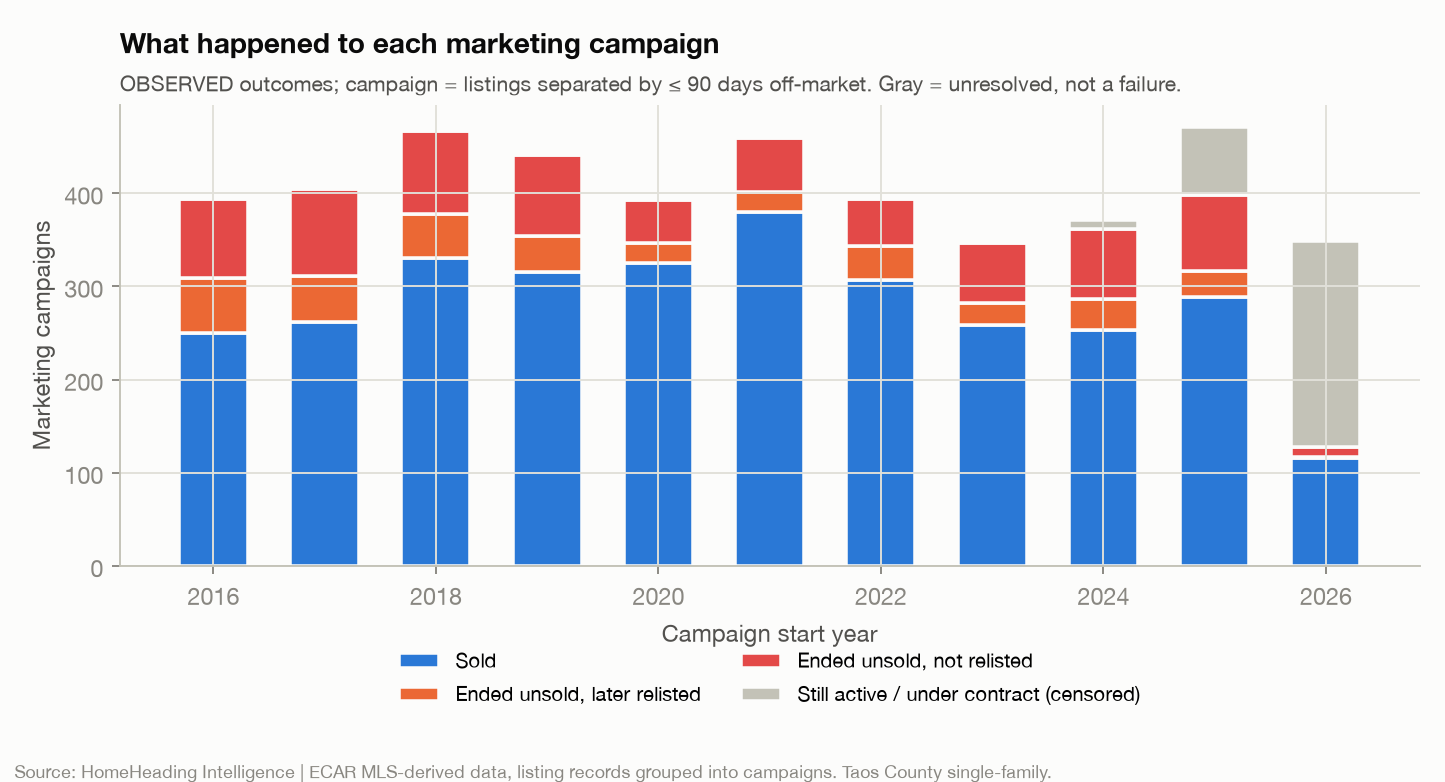
Listings separated by no more than 90 days off the market are grouped into one marketing campaign, and each bar divides the campaigns that began in a given year by how they ended. Gray marks campaigns still active or under contract at the October 18, 2026 cutoff — unresolved, not failed — which is why the 2025 and 2026 bars are not yet complete.
Method: OBSERVED outcomes; campaign = listings separated by ≤ 90 days off-market. Gray = unresolved, not a failure.
Source: Listing records grouped into campaigns. Taos County single-family homes. HomeHeading Intelligence analysis of Enchanted Circle Association of REALTORS® MLS records observed through October 18, 2026. Data deemed reliable but not guaranteed. Full-size chart: What happened to each marketing campaign
3. How long does it actually take to sell a home?
Days on market is among the most frequently quoted statistics in real estate.
It’s also one of the easiest to misunderstand.
A property may appear in the MLS with 75 or 100 days on market, but that figure may not represent its entire marketing history.
The property might have been listed previously, withdrawn for several months, and returned under a new MLS number. It might have experienced unsuccessful contract attempts or significant price adjustments before its final listing.
By reconstructing individual property histories, HomeHeading Intelligence can examine those earlier attempts and distinguish the time associated with a single listing from the total exposure involved in eventually selling the property.
The results are revealing.
Among 465 Taos County home sales between 2016 and 2026 that followed two or more MLS listing records within the same reconstructed sale attempt:
- The median days on market reported for the final MLS listing was 105 days.
- The median cumulative MLS days on market was 153 days.
- The median actual time listed across all linked records was 400 days.
- The median elapsed time from the first listing to the eventual sale was 638 days, including periods when the property was off the market.
These represent different measures of time, and they shouldn’t be used interchangeably. But the contrast illustrates how much historical exposure may be missing when we look only at the final listing.
Figure 4 · Taos market anatomy, 2016–2026
Relisted homes: exposure the MLS clock doesn’t show (n = 465 sales)
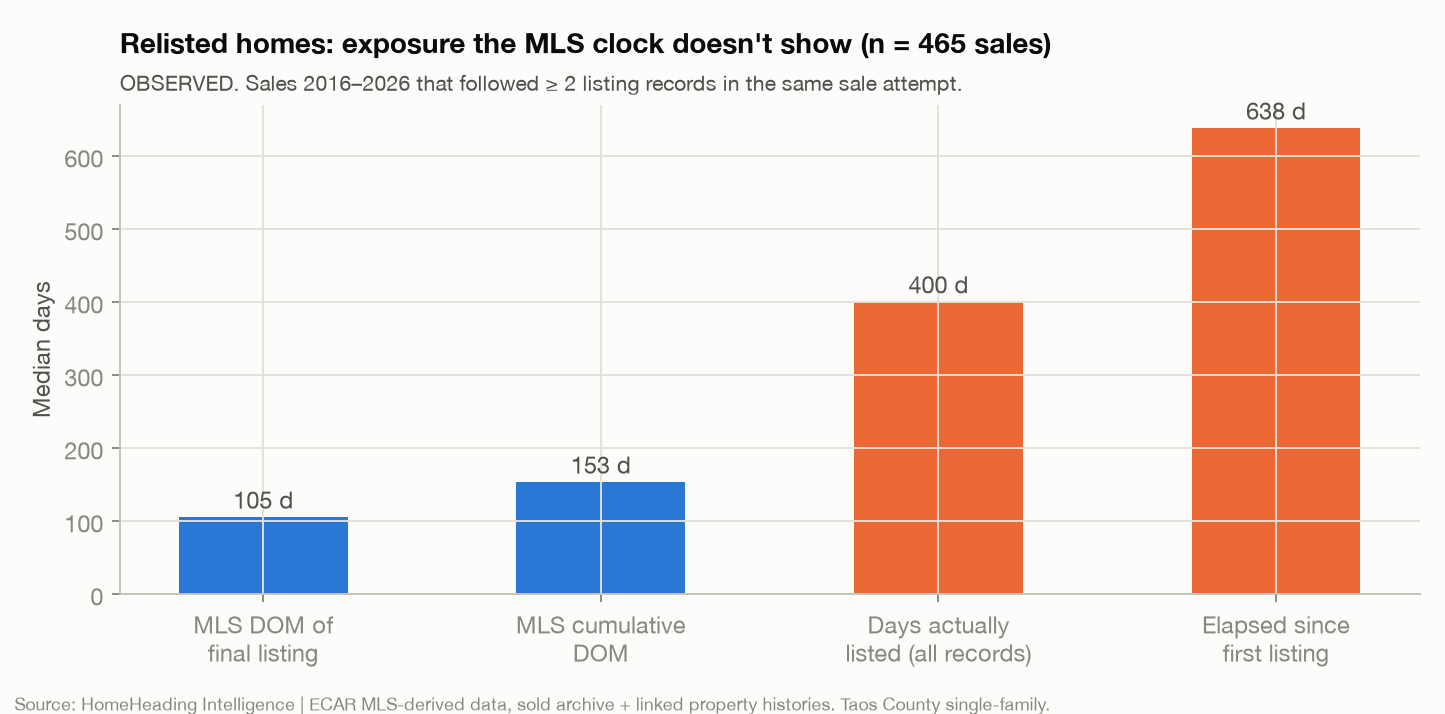
Four ways of measuring time for the same 465 sales, each of which followed two or more listing records within one reconstructed sale attempt. The blue bars are what the MLS reports; the orange bars add the earlier listings, and the last also counts time the home was off the market. They measure different things and should not be used interchangeably.
Method: OBSERVED. Sales 2016–2026 that followed ≥ 2 listing records in the same sale attempt.
Source: Sold archive and linked property histories. Taos County single-family homes. HomeHeading Intelligence analysis of Enchanted Circle Association of REALTORS® MLS records observed through October 18, 2026. Data deemed reliable but not guaranteed. Full-size chart: Relisted homes: exposure the MLS clock doesn’t show (n = 465 sales)
There’s another revealing difference.
For these repeatedly listed properties, the median sale price represented 94.6% of the original asking price on the final MLS listing.
Compared with the property’s first asking price in its reconstructed sale attempt, however, the median was only 88.1%.
The final listing can therefore present a very different picture of the relationship between the seller’s original expectations and the eventual transaction.
This doesn’t mean relisting causes a lower sale price. Properties requiring multiple attempts may be unusually difficult to value, face limited demand, or have other obstacles.
But it does demonstrate why the complete property history matters.
When I evaluate a property for a buyer or seller, I want to understand more than its present asking price and current days on market. I want to understand the history of the property’s interaction with the market.
That history can reveal much more about the circumstances surrounding a transaction.
4. The hidden friction: Contracts that never close
Perhaps the most surprising finding in this research concerns properties that successfully attract an offer but never reach the closing table.
A listing going under contract is an important milestone. But an accepted offer isn’t the same as a completed sale.
Inspection negotiations, financing, appraisal issues, buyer contingencies, and other circumstances can prevent a transaction from closing.
Conventional historical MLS records generally preserve the final status of a listing, but earlier unsuccessful contracts may be overwritten as the listing progresses through subsequent transactions.
Because HomeHeading Intelligence began preserving successive weekly listing observations in 2026, we can now observe many of these transitions directly.
Between January 18 and October 18, 2026, the research tracked 276 individual contract episodes involving Taos County single-family homes.
Of those:
- 184 resulted in completed sales.
- 60 failed to close.
- 32 remained under contract at the observation cutoff.
Among contracts with resolved outcomes, 24.6% failed to close, with a 95% confidence interval of approximately 19.6–30.4%.
That’s roughly one in four.
Contract stage also mattered.
Contracts classified as contingent or still being shown experienced an observed fallout rate of approximately 28.6%. Contracts that reached firm under-contract status had a lower observed fallout rate of approximately 17.9%.
These are different observed contract-stage groups, not proof that any particular contingency caused a failure.
Figure 5 · Taos market anatomy, 2016–2026
2026 contract fallout by contract stage and price band
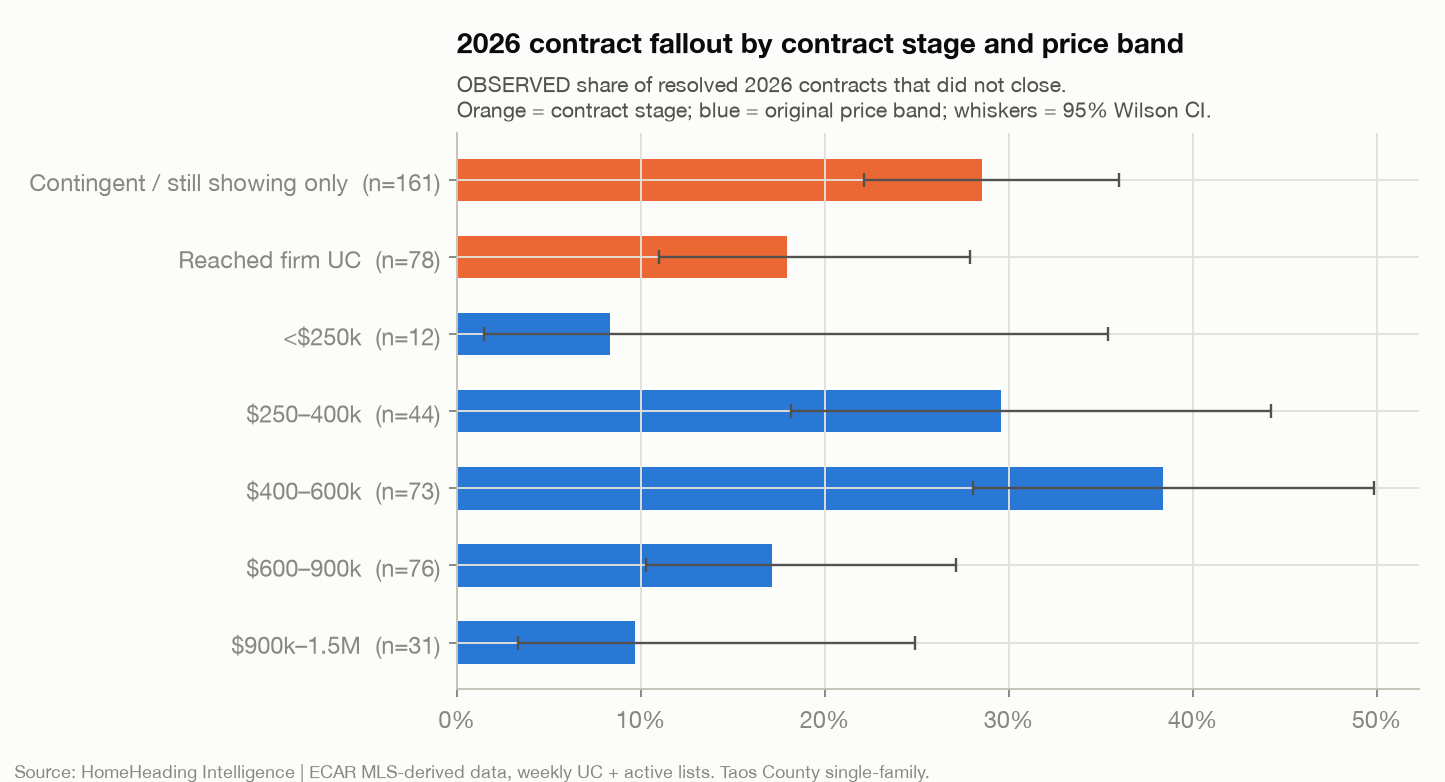
Each bar is the share of resolved 2026 contracts that did not close; contracts still open at the cutoff are not included. Whiskers show the 95% confidence range. Several price bands contain few contracts — only 12 under $250,000 — so their ranges are wide and differences between bands should be read with caution. The data do not record why a contract failed.
Method: OBSERVED share of resolved 2026 contracts that did not close. Orange = contract stage; blue = original price band; whiskers = 95% Wilson CI.
Source: Weekly under-contract and active lists. Taos County single-family homes. HomeHeading Intelligence analysis of Enchanted Circle Association of REALTORS® MLS records observed through October 18, 2026. Data deemed reliable but not guaranteed. Full-size chart: 2026 contract fallout by contract stage and price band
The median time from contract formation to an observed failure was just 21 days.
That timing overlaps with common inspection and financing contingency periods, although the underlying database does not identify the reasons individual contracts were terminated.
What happens to those homes afterward is equally interesting.
Among 52 listings experiencing a failed contract during 2026, 26 entered another contract, 22 subsequently reduced their asking prices, and 18 eventually sold by the observation cutoff.
A failed contract, then, is not necessarily the end of the property’s marketing journey.
But it can represent another interruption in an already lengthy process.
One limitation is especially important: earlier historical MLS records do not reliably preserve unsuccessful contracts. We therefore cannot establish whether the 2026 fallout rate is higher or lower than in previous years.
What we can establish is that contract failures represent a substantial source of friction in today’s market—and that preserving those events allows us to measure something conventional historical reports have largely obscured.
5. Pricing strategy: What succeeds, what struggles, and why?
With a clearer understanding of market activity and unsuccessful transactions, we can turn to one of the most consequential decisions a homeowner makes: the initial asking price.
Every property is different, particularly in Taos.
Architecture, construction quality, location, views, guest accommodations, water rights, and other characteristics can make one property substantially more desirable than another with similar square footage.
Nevertheless, the historical record reveals a strong relationship between initial asking prices and the probability of completing a sale.
Using a statistical valuation model based on available property characteristics and historical sales, HomeHeading Intelligence compared original asking prices with estimated market values.
Among resolved listing records from 2016–2025:
| Initial asking price relative to modeled value | Observed sale rate |
|---|---|
| More than 5% below | 75% |
| Within approximately 5% | 79% |
| 5–15% above | 75% |
| 15–30% above | 67% |
| More than 30% above | 52% |
After accounting for several measurable property characteristics and market conditions, the relationship remained statistically evident for listings opening more than 15% above modeled value. The difference for listings 5–15% above was not statistically distinguishable from listings priced within approximately 5%.
However, the valuation model cannot fully capture every quality that makes a Taos property distinctive. Some homes classified as high-priced by the model may have legitimate characteristics that justify a premium.
That’s an important qualification.
The research does not establish that every property listed substantially above its statistical valuation is incorrectly priced.
What it does establish is that the further an asking price moves above the comparable-value benchmark, the lower its observed probability of selling.
Figure 6 · Taos market anatomy, 2016–2026
Sale rate by initial pricing position (records listed 2016–2025)
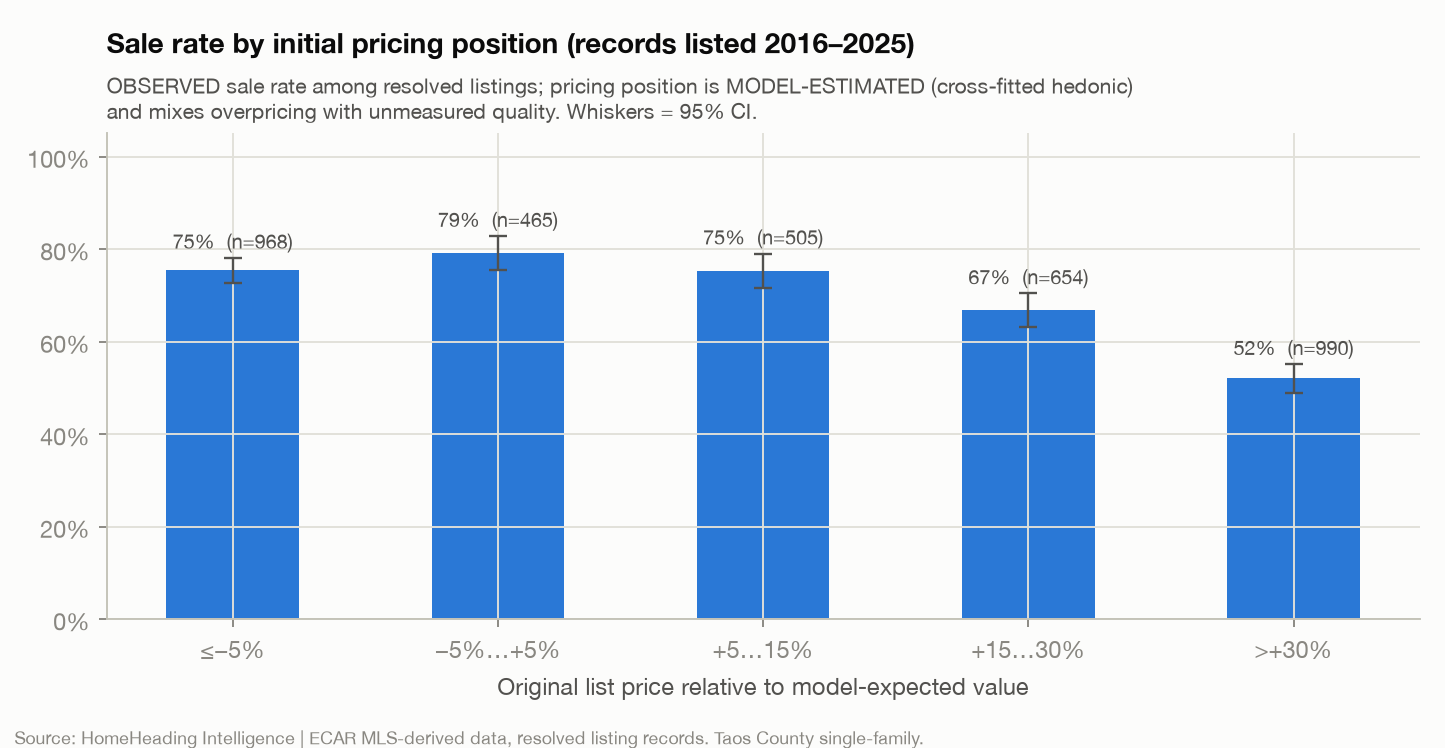
Sale rate among resolved listing records from 2016–2025, grouped by how the original asking price compared with a statistical estimate of the home’s value; n is the number of listings in each group and the whiskers show 95% confidence ranges. The model cannot see everything — condition, views and other distinctive features — so a listing classed as priced high may partly reflect qualities the model doesn’t measure.
Method: OBSERVED sale rate among resolved listings; pricing position is MODEL-ESTIMATED (cross-fitted hedonic) and mixes overpricing with unmeasured quality. Whiskers = 95% CI.
Source: Resolved listing records. Taos County single-family homes. HomeHeading Intelligence analysis of Enchanted Circle Association of REALTORS® MLS records observed through October 18, 2026. Data deemed reliable but not guaranteed. Full-size chart: Sale rate by initial pricing position (records listed 2016–2025)
Does testing the market high actually pay?
This finding led to a second, more focused investigation.
A homeowner might reasonably ask whether starting with an ambitious price is worthwhile if the eventual sale produces more money.
To explore that question, HomeHeading Intelligence conducted a separate analysis of 2,975 Taos County sale attempts initiated between April 2016 and October 2025.
Within that study population, the matched comparisons used smaller samples: 467 sale attempts that opened 15–30% above estimated value, compared with 666 matched competitively priced homes, and 934 that opened more than 30% above, compared with 786.
Properties were grouped by their original asking prices relative to estimated market value and compared with similar competitively priced homes from comparable listing periods and geographic areas.
The analysis accounted for observable differences such as size, acreage, age, bedrooms, garages, guest houses, and other property characteristics.
Crucially, homes that never sold remained in the analysis.
The results suggest that testing the market high carries meaningful disadvantages without a reliably demonstrated financial reward.
Using independent valuation comparisons intended to reduce pricing-model bias, homes initially listed more than 15% above estimated value ultimately sold for approximately the same market-adjusted prices as comparable competitively priced homes.
Two separate tests estimated sale-price differences of −0.6% and −2.7%, neither statistically distinguishable from zero.
Those estimates have meaningful uncertainty, and the study cannot rule out every financial advantage or disadvantage. But it did not identify reliable evidence that starting substantially above market value produces higher eventual proceeds.
Figure 7 · Supplemental pricing study
Do high starters sell for more than comparable homes?
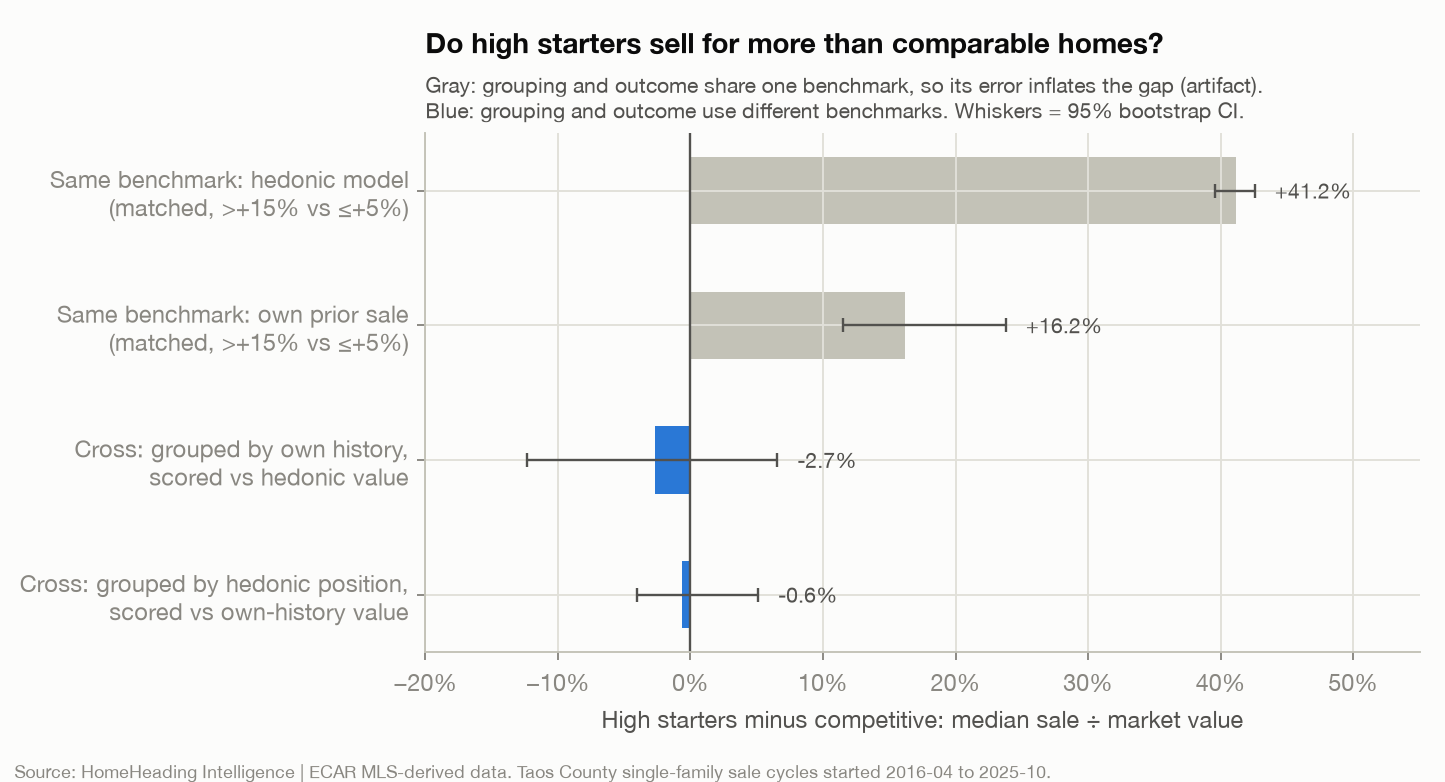
Each bar estimates how homes that opened more than 15% above estimated value sold, relative to market value, compared with matched competitively priced homes. The gray bars use the same benchmark both to group the homes and to measure the result, which inflates the apparent gap; they are shown to illustrate that bias, not as findings. The blue bars use independent benchmarks: −2.7% and −0.6%, with confidence ranges that include zero.
Method: Gray: grouping and outcome share one benchmark, so its error inflates the gap (artifact). Blue: grouping and outcome use different benchmarks. Whiskers = 95% bootstrap CI.
Source: Sale cycles started April 2016 to October 2025. Taos County single-family homes. HomeHeading Intelligence analysis of Enchanted Circle Association of REALTORS® MLS records observed through October 18, 2026. Data deemed reliable but not guaranteed. Full-size chart: Do high starters sell for more than comparable homes?
The differences in time and sale probability were considerably clearer.
Compared with similar competitively priced properties, homes opening 15–30% above estimated value were approximately eight percentage points less likely to sell within a year.
For homes opening more than 30% above estimated value, the disadvantage increased to approximately 18 percentage points.
Among properties that ultimately sold, the most aggressively priced group took approximately 55 additional days to reach a contract and 55 additional days to close.
In practical terms, sellers who begin substantially above estimated value may find themselves waiting longer for a transaction without obtaining a demonstrably higher market-adjusted sale price.
And a greater proportion of those homes never complete a sale through the MLS during the observed period.
These are observational relationships, not proof that pricing alone caused the different outcomes. Sellers who choose ambitious opening prices may also differ in motivation, negotiation flexibility, property characteristics, or willingness to wait.
Still, the findings make one point difficult to overlook:
A higher asking price does not necessarily translate into a higher sale price, and the decision to start high carries meaningful risks beyond the eventual amount received.
Figure 8 · Supplemental pricing study
Matched comparison with competitively priced homes (difference, high minus competitive)
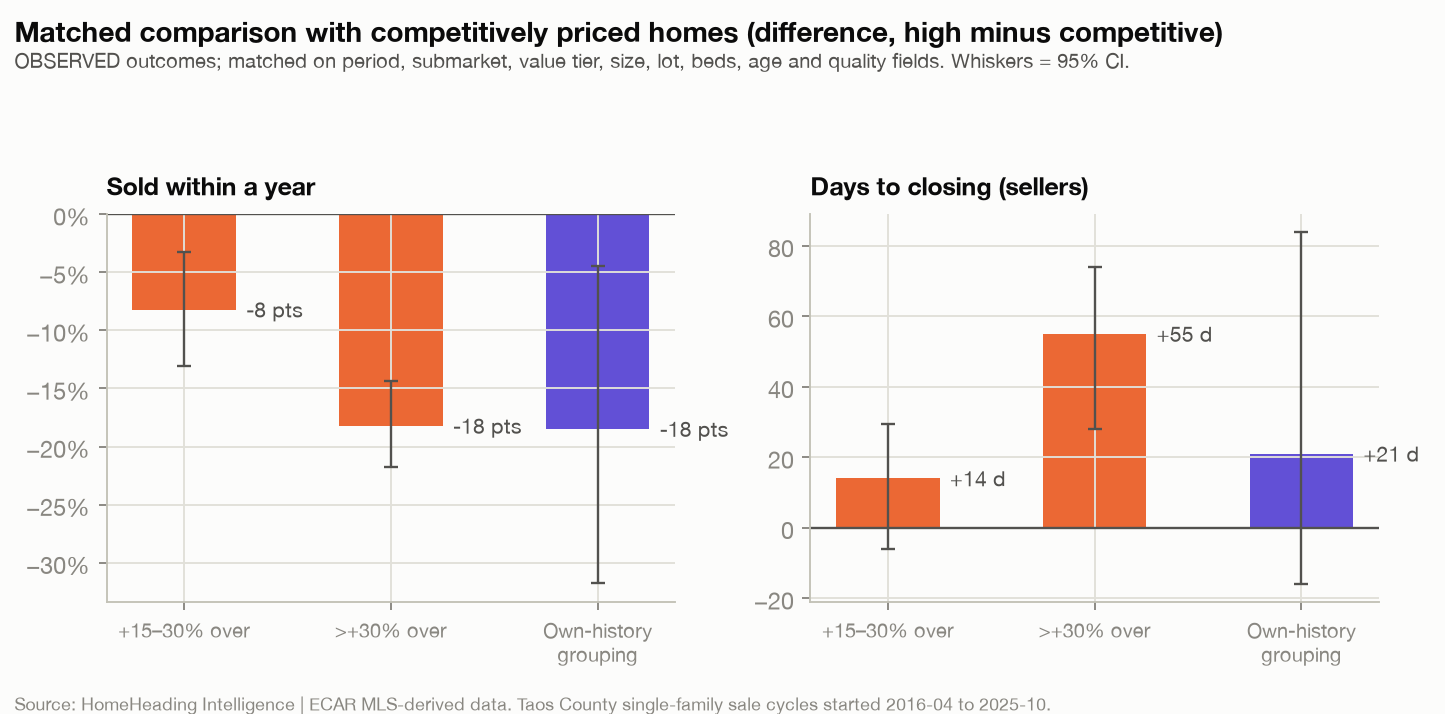
Differences between homes that opened above estimated value and matched, competitively priced homes from comparable periods and areas. Left: the change in the share that sold within a year, in percentage points. Right: additional days to closing among homes that sold. Whiskers show 95% confidence ranges; the own-history grouping uses a different value benchmark and is much less precise. These are observed associations, not proof that the opening price caused the difference.
Method: OBSERVED outcomes; matched on period, submarket, value tier, size, lot, beds, age and quality fields. Whiskers = 95% CI.
Source: Sale cycles started April 2016 to October 2025. Taos County single-family homes. HomeHeading Intelligence analysis of Enchanted Circle Association of REALTORS® MLS records observed through October 18, 2026. Data deemed reliable but not guaranteed. Full-size chart: Matched comparison with competitively priced homes (difference, high minus competitive)
6. What about reducing the price later?
It’s common for sellers to consider an aspirational opening price with the understanding that they can reduce it if necessary.
The historical evidence allows us to examine how that approach appears in actual market outcomes.
Among the 601 single-family listings observed active during 2026 through successive weekly observations, approximately 37% experienced at least one asking-price reduction.
The median individual reduction was 4.7%, or approximately $24,000.
Figure 9 · Taos market anatomy, 2016–2026
How big are 2026 price cuts?
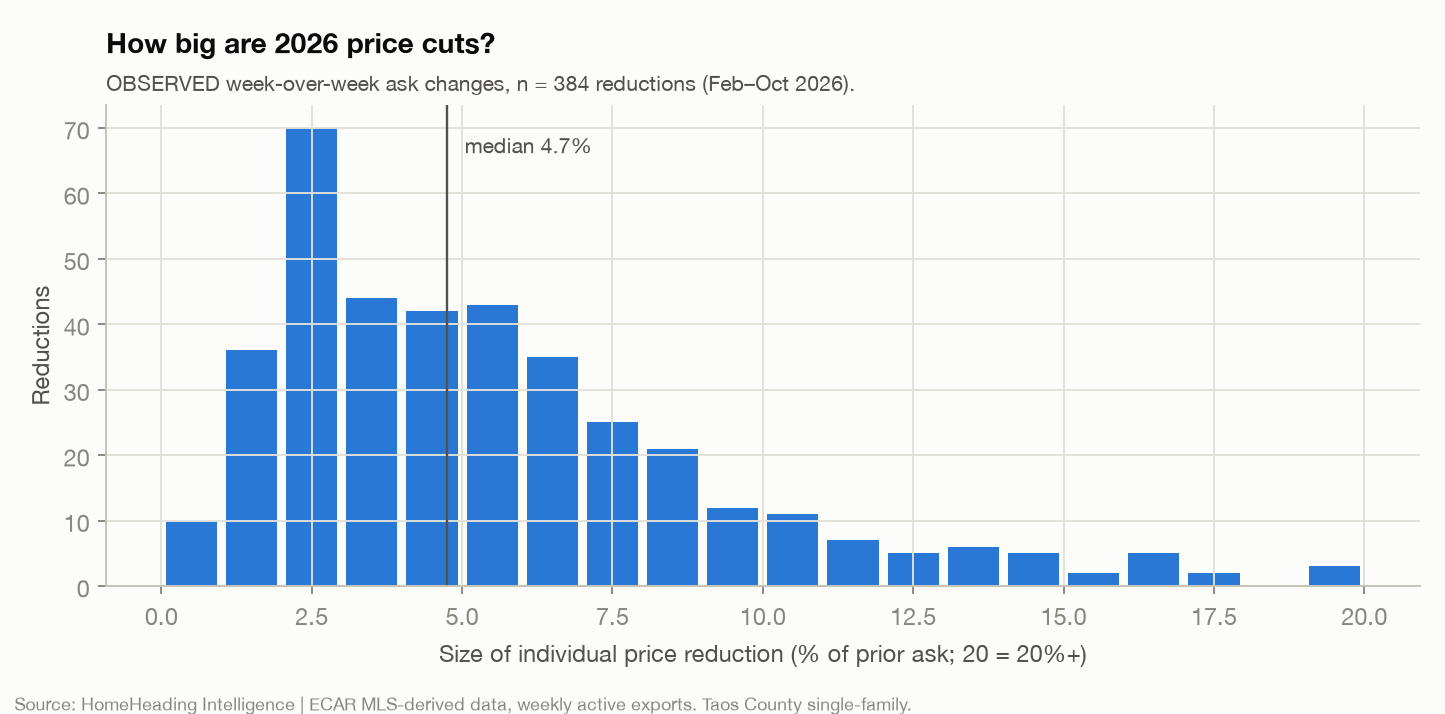
Every week-over-week asking-price reduction observed on 2026 single-family listings, February through October, sized as a share of the prior asking price (the last bar includes reductions of 20% or more). A listing that reduced its price more than once is counted once for each reduction.
Method: OBSERVED week-over-week ask changes, n = 384 reductions (Feb–Oct 2026).
Source: Weekly active exports. Taos County single-family homes. HomeHeading Intelligence analysis of Enchanted Circle Association of REALTORS® MLS records observed through October 18, 2026. Data deemed reliable but not guaranteed. Full-size chart: How big are 2026 price cuts?
But reductions don’t automatically lead to immediate contracts.
Among 394 newly listed homes tracked from entry in 2026, the research compared the probability of receiving a first contract with the probability of making a first price reduction.
By day 30, approximately 16% had secured a contract before any reduction, while 7% had reduced their price first.
By day 60, the two outcomes were nearly equal.
By day 120, approximately 40% had reduced their asking price before receiving a contract, while 27% had secured a contract before making a reduction.
Figure 10 · Taos market anatomy, 2016–2026
2026 new listings: which comes first — a contract or a price cut?
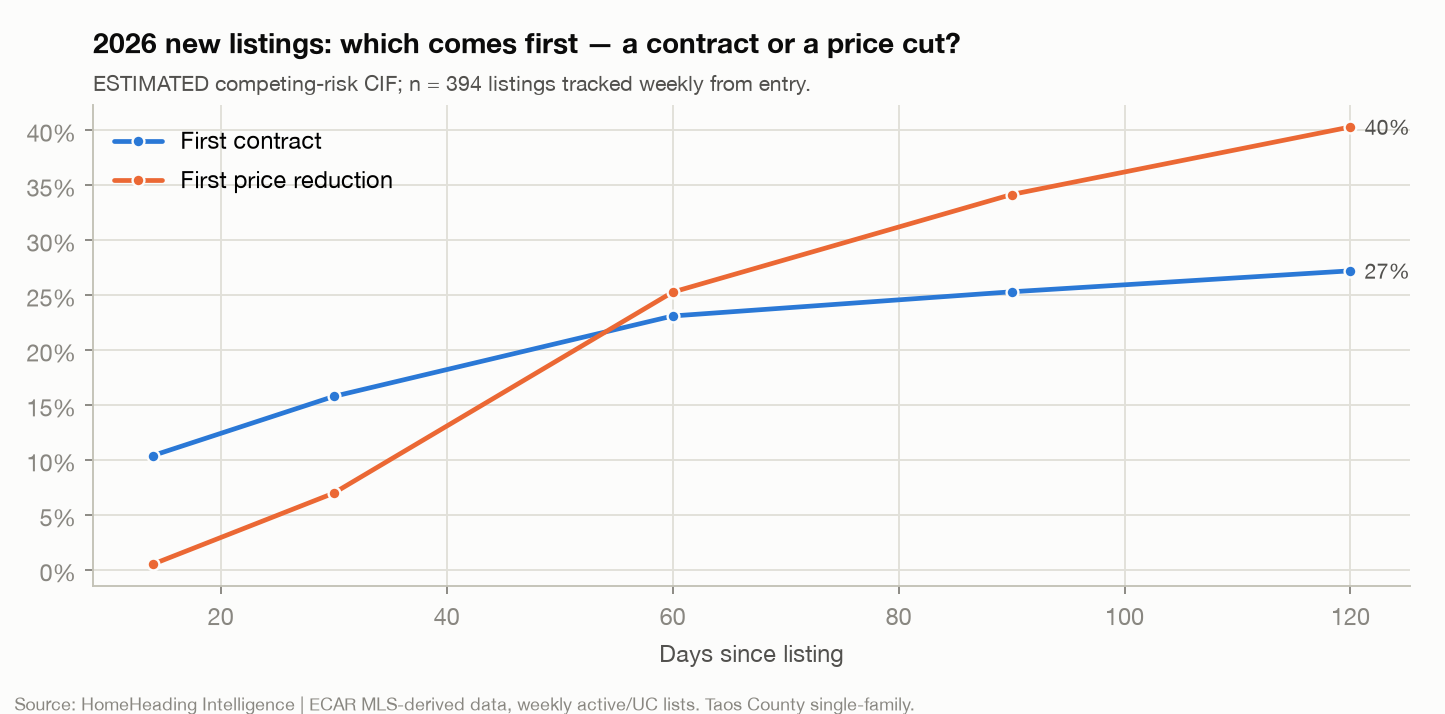
For 394 single-family homes listed in 2026 and tracked weekly from their first appearance, the estimated share whose first event was a contract, compared with the share whose first event was a price reduction. The chart shows which came first, not whether a reduction led to a sale.
Method: ESTIMATED competing-risk CIF; n = 394 listings tracked weekly from entry.
Source: Weekly active and under-contract lists. Taos County single-family homes. HomeHeading Intelligence analysis of Enchanted Circle Association of REALTORS® MLS records observed through October 18, 2026. Data deemed reliable but not guaranteed. Full-size chart: 2026 new listings: which comes first — a contract or a price cut?
This doesn’t tell us whether those reductions ultimately succeeded, or whether reducing earlier would have improved the outcome.
In fact, the available historical records don’t consistently preserve the precise timing of earlier price reductions, and the 2026 sample is not yet large enough to establish which reduction schedules work best.
But the findings illustrate how quickly the experience of marketing a property can change.
A home that enters the market at a price buyers consider attractive may secure a contract relatively early. A property that doesn’t attract a buyer may begin moving through a different sequence of events: extended exposure, price adjustments, renewed marketing, and potentially additional listing attempts.
The initial asking price is therefore more than a statement of the seller’s expectations. It’s an important part of how a property enters and competes within the market.
7. There isn’t just one Taos housing market
Market-wide statistics are useful, but they can obscure substantial differences between properties.
A modest home in town, a historic adobe in Ranchos de Taos, a contemporary property in El Prado, and a large estate in the north valley may attract different buyers and face very different levels of competition.
The historical data supports that distinction.
Among listings initiated between 2023 and 2025, observed sale rates among resolved listings varied considerably by original asking-price range.
| Original asking-price range | Observed sale rate |
|---|---|
| Under $250,000 | 71% |
| $250,000–$400,000 | 72% |
| $400,000–$600,000 | 68% |
| $600,000–$900,000 | 66% |
| $900,000–$1.5 million | 52% |
| Above $1.5 million | 38% |
Higher-priced properties generally had lower observed sale rates and longer marketing periods.
Property size mattered as well. Homes exceeding 3,500 square feet and homes with five or more bedrooms recorded sale rates of approximately 37%.
Geographic differences were also apparent, with some rural and less densely populated submarkets experiencing lower sale conversion than more active areas.
These results shouldn’t be interpreted as predictions for individual properties. Unusual homes may require specialized marketing and a longer period to reach the right buyer.
But the data reinforces an important point: the conditions affecting a property depend heavily on its particular market segment.
When evaluating a listing, I don’t believe it’s enough to know the county-wide median sale price or average days on market. The relevant question is how comparable properties, competing for similar buyers, have actually performed.
That’s one of the reasons I’ve invested in developing more detailed market intelligence.
8. What does all of this tell us about the Taos market today?
Taken together, these findings describe a market that remains active but operates with considerably more friction than many participants experienced during the pandemic years.
Inventory has returned to levels familiar before 2020.
Homes continue to sell, and completed transactions through September 2026 exceeded the comparable period in both 2024 and 2025.
Yet unsuccessful marketing attempts remain common. A meaningful share of properties expire, withdraw, or re-enter the market before finding a buyer. Contracts do not always close. Repeated listings can conceal lengthy cumulative exposure, and the relationship between original asking price and eventual outcome is substantial.
None of this means that the Taos housing market is uniformly weak.
Some properties sell relatively quickly and achieve prices close to their original asking prices. Others require extensive marketing, adjustments, or repeated attempts.
The differences are not random, but neither can they be explained by any single statistic.
Price, property characteristics, location, market timing, competition, and seller flexibility all contribute to the process.
From a longer historical perspective, today’s conditions increasingly resemble the years before the pandemic rather than an unprecedented deterioration.
From the perspective of an individual buyer or seller, however, those conditions still require careful decisions.
The market offers opportunities. It also imposes real costs on strategies that don’t align with buyer demand.
And understanding those differences is where good market intelligence becomes genuinely useful.
9. Why I invest in understanding the market this way
As a real estate broker, I see my responsibility as more than helping people complete transactions.
I want to help clients make informed decisions under conditions of uncertainty.
That requires understanding not just what a property might be worth, but how the market is likely to respond to it, what alternatives exist, and what risks accompany different choices.
It’s also why I’ve spent considerable time developing HomeHeading Intelligence.
By preserving historical records and reconstructing individual property histories, I’m able to investigate questions that conventional market reports don’t adequately answer.
How many comparable properties failed to sell? How frequently were they relisted? What did they ultimately sell for, if they sold at all? How did their initial pricing strategies compare? And how has buyer behavior changed over time?
Those questions matter when advising a homeowner about listing strategy.
They also matter when helping a buyer evaluate a property that has been on the market for an extended period, or when determining how much flexibility might exist in a negotiation.
No database or analytical model can eliminate uncertainty. Real estate is too individual for that, especially here in Taos.
But better information can produce better questions, more informed strategies, and a clearer understanding of the trade-offs involved.
That’s the approach I try to bring to every client relationship: independent research, careful analysis, and practical experience working in the local market.
Let’s Put That Research to Work for You
If you’re considering selling a property in Taos County, I’d be glad to help you understand not only what comparable homes have sold for, but how similar properties have performed throughout their marketing histories.
We can examine competing inventory, historical sales, market exposure, pricing strategies, and the considerations that may affect your property’s position in the market.
If you’re buying, the same research can help place a property’s asking price, listing history, and market competition into a more meaningful context.
And if you’re simply interested in understanding the Taos real estate market, I welcome the conversation.
I believe the best real estate decisions begin with a clear understanding of the market—and I enjoy helping people develop that understanding.
Research notes and methodology
This report draws on MLS-derived residential records captured and analyzed by HomeHeading Intelligence through October 18, 2026. The study focuses on Taos County single-family residences and excludes the separate Colfax County resort market.
The broader longitudinal analysis identified 3,733 individual properties, 5,270 MLS listing records, and 4,118 reconstructed sale attempts since 2016. The supplemental pricing analysis included 2,975 sale attempts initiated between April 2016 and October 2025, each with at least one year of follow-up; its matched comparisons used smaller subsets of that population.
Historical property identity was reconstructed using listing identifiers, normalized addresses, available parcel information, and other corroborating evidence. Multiple MLS records may represent one property or one continuous marketing effort. Different definitions of marketing continuity can produce different sale-conversion rates.
The 2026 contract-failure analysis uses successive weekly MLS observations. Most unsuccessful contracts from earlier years cannot be reliably reconstructed from conventional archived records. Some 2026 weekly captures are missing, and withdrawn-listing captures stopped after September 13, 2026, leaving the outcomes of 31 listings unknown.
Initial pricing positions were evaluated using statistical valuation models and matched-property analyses. Statistical models cannot capture all property characteristics, and observed relationships do not establish causation. Price comparisons may also exclude seller concessions that were not consistently recorded.
This research describes historical market activity, not guaranteed results for any individual property. Figures should be understood within their stated observation periods, populations, and methodological limitations.
Research and analysis: HomeHeading Intelligence
Publication: Taos Real Estate Intelligence
Author: Chad Belvill, Dreamcatcher Real Estate Co. Inc.